Bose Hubbard model
Introduction
The Bose-Hubbard Model (BHM) was first studied in theoretical detail in 1989 by Fisher et al.[1].

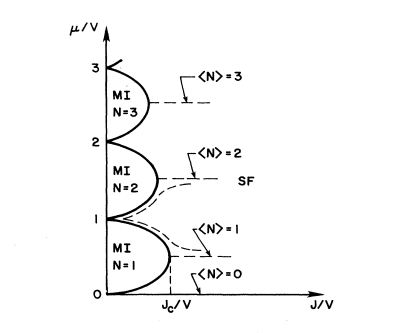
It was discovered that at zero temperature if the bosons are in a lattice they can be in one of two phases. The phase diagram in figure 1 shows this explicitly: there is the superfluid phase and the Mott insulator phase. The phase the system is in depends on the strength of the hopping interaction(J in the figure 1, _ in our analysis) as well as the chemical potential (which sets the particle number) and the on site repulsion (V in figure 1, _ in our analysis).
Hamiltonian
Solving the Hamiltonian
The single site Hamiltonian for interacting bosons is:
Where and , are c-numbers.
In this case the Hamiltonian can be rewritten as:
.
Unnormalized eigenstates of this Hamiltonian are.
The normalized eigenstate is with eigenenergy
The ground state of which is unique for the ratio and degenerate for
Phase Transition
Experimental Evidence - Bose-Einstein Condensate[2]
Experimental Setup

The first experimental evidence in support of the BHM was observed in 2002.[2]
Greiner and collaborators created a Bose-Einstein condensate that was spherically symmetric, and magnetically trapped. To form the three dimensional lattice potential three optical standing waves were set up perpendicular to eachother with the crossing point of the three beams positioned at the center of the condensate. The magnetically trapped condensate was then transferred to the optical lattice by slowly increasing the beam intensity. By increasing slowly it was ensured that the atoms stayed in the many body ground state. When the beams reached full intensity the condensate was spread over more than 150,000 lattice sites with an average of 2.5 atoms per lattice cite in the center of the condenstate
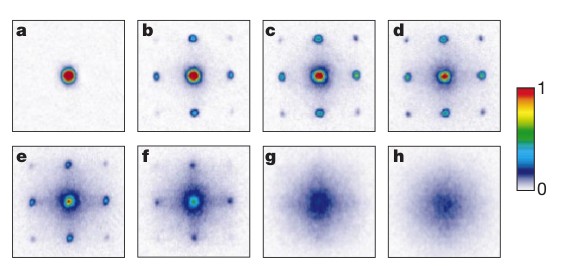
Adjusting the potential depth via frequency variations allowed for Greiner et al. to essentially set the phase of the condensate. When they would set a potential, they would then turn it off. The atomic wavefunctions then expand freely and interfere with eachother. This allowed for a test of phase coherence of the system via diffraction patterns.
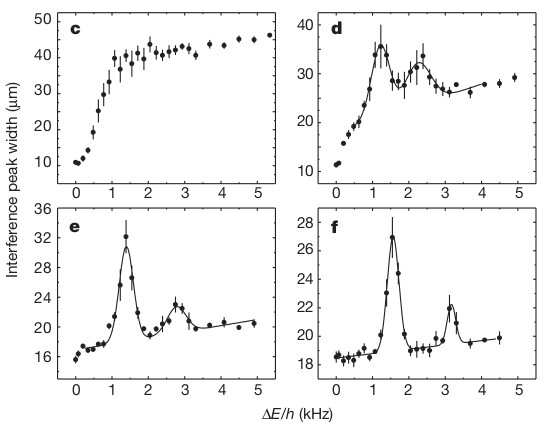
The phase was also tested by measuring the excitation spectrum of the condensate, as the superfluid state and the Mott insulator state should have markedly different spectrum's. In the Mott insulator phase the atoms are well localized in the lattice. An excitation occurs when a particle hole pair is created. For example if we had exactly one particle per lattice site, then an excitation would be when one particle tunnels to an adjacent site, creating a site with no particles and a site with two. To realize this excitation in the lab the lattice potential is tilted by the application of a potential gradient. This creates an energy difference between neighboring lattice sites that allows for the tunneling to an excited state. It was expected to see resonant excitations in the plot of intereference peak width versus energy difference in neighboring lattice sites.

Superfluid Phase
For the superfluid phase it was expected to observe sharp diffraction patterns. This is due to the fact that in the superfluid phase all atoms are delocalized, with equal relative phases between different lattice sites. Therefore the sharp diffraction patterns represent extreme phase coherence in the system.
In the excitation spectrum it was expected to not see resonant structure for the superfluid phase. It can be seen in figure 3 that this is the case. In box c, which corresponds to the superfluid lattice depth, there is no structure in the excitation spectrum
Mott Insulator Phase
For the Mott insulator phase it was expected to have a blurred diffraction pattern. This is because the system should lose all phase coherence which will result in no observable diffraction pattern. It can be observed in figure 2 X that there is a clear loss of sharp diffraction patterns in box g, this corresponds to the onset of the Mott insulator phase.
In contrast to the superfluid phase, the Mott insulator phase should display resonant features in the excitation spectrum. We can see from figure 3 that the emergence of this behavior begins in plot d. As the lattice potential depth is increased, and it transitions past the critical point where the phase transition occurs, the resonance structure becomes more clearly defined.


