7th Week: Stellar Structure and Evolution B
Stellar properties
Stars begin their formation from a slowly rotating cloud of matter called interstellar cloud. At some point matter starts grouping, hence attracting more matter due to gravitational interaction. Because of conservation of angular momentum, when matter starts grouping, it starts rotating faster and faster. After approximately Failed to parse (SVG (MathML can be enabled via browser plugin): Invalid response ("Math extension cannot connect to Restbase.") from server "https://wikimedia.org/api/rest_v1/":): {\displaystyle 10^5} year since the process started, the density in the core of the now protostar becomes higher and so does the temperature. This part of stellar evolution is characterized by a central star and disk surrounded by an envelope of dust and gas. The protostar continue its evolution, increasing its temperature and luminosity. At some point develops a stellar wind going out mainly from the two poles. When the stellar wind is emitted in all directions the star separates from its parental cloud of dust and gas, being this pushed out by the stellar wind. By now the star is fully formed and starts its evolution towards the main sequence of the H-R diagram (see next section).
The star can be characterized by several physical quantities such as its luminosity, mass and radius. Luminosity is the amount of energy a body radiates per unit time. For the sun we have the following values:
solar mass: Failed to parse (SVG (MathML can be enabled via browser plugin): Invalid response ("Math extension cannot connect to Restbase.") from server "https://wikimedia.org/api/rest_v1/":): {\displaystyle \begin{smallmatrix}M_\odot = 1.9891 \times 10^{30}\end{smallmatrix}} kg
solar luminosity: Failed to parse (SVG (MathML can be enabled via browser plugin): Invalid response ("Math extension cannot connect to Restbase.") from server "https://wikimedia.org/api/rest_v1/":): {\displaystyle \begin{smallmatrix}L_\odot = 3.827 \times 10^{26}\end{smallmatrix}} watts
solar radius: Failed to parse (SVG (MathML can be enabled via browser plugin): Invalid response ("Math extension cannot connect to Restbase.") from server "https://wikimedia.org/api/rest_v1/":): {\displaystyle \begin{smallmatrix}R_\odot = 6.960 \times 10^{8}\end{smallmatrix}} m
Is common to express these physical quantities for other stars and astronomical objects in terms of fractions of the solar mass, luminosity and radius. Other important quantity is the surface temperature (in Kelvin).
Hertzsprung-Russell Diagram
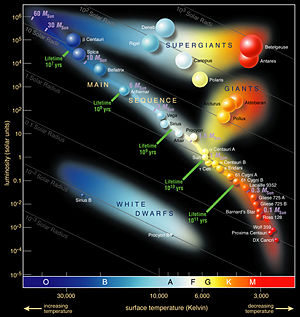
The Hertzsprung-Russell diagram (or H-R diagram) was created by both Ejnar Hertzsprung and Henry Norris Russell. The H-R diagram is generated by plotting the luminosity of the stars against their temperature at the surface. Here luminosity is the amount of energy a body radiates per unit time. This quantity is often measured in solar luminosities. One solar luminosity is equal to Failed to parse (SVG (MathML can be enabled via browser plugin): Invalid response ("Math extension cannot connect to Restbase.") from server "https://wikimedia.org/api/rest_v1/":): {\displaystyle 3.846x 10^{26}} which is equivalent to our sun's luminosity. The majority of the stars lay in the diagonal region that goes from top left to bottom right on Figure 1. This region is known as main sequence. The stars in this region are in the Hydrogen burning process. The most luminous stars have luminosities near Failed to parse (SVG (MathML can be enabled via browser plugin): Invalid response ("Math extension cannot connect to Restbase.") from server "https://wikimedia.org/api/rest_v1/":): {\displaystyle 10^6} solar luminosities, but this star are extremely rare.
Depending on the initial mass of the star, its evolution can take different paths in the H-R diagram.
Stellar evolution
Stellar evolution is the study of stars and their processes through out the course of their lifetimes. More specifically, Astrophysicists study a range of stars at various stages of their lifetime. All stable stars maintain a balance between the force of gravity and the internal pressure, preventing them from collapsing. In stellar plasma there are several reaction networks. The reactions with the smallest Coulomb barrier take place in the shortest time and are responsible for most of the nuclear energy generation.
Hydrostatic hydrogen burning
Hydrogen burning produces more energy than any other fuel consumed in stars. This form of burning is also highly favored for young stars as they consist mostly of hydrogen. Also, this burning stage marks the star as a main sequence star (see HR diagram).
The two principle ways by which hydrogen is converted to helium in hydrostatic hydrogen burning are called the proton–proton (pp) chains and the CNO cycles.
pp chain
The pp chain is the process by which protons undergo fusion to helium. This chain actually comes in three forms but is dominated mostly by the ppI chain. This process occurs in three steps. The first is the fusion of two protons to form deuterium. Naturally one would assume that the two protons would form helium-2 but this is not within the drip-line. The logical next step would be to fuse two deuterium into helium-4, but this is unfavorable as the deuterium concentrations are low. So the next step is fusing a proton and deuterium. The final step is two fuse two helium-3 atoms into beryllium-6 which immediately decays to helium-4 and two protons. This can be summed up as:
Failed to parse (SVG (MathML can be enabled via browser plugin): Invalid response ("Math extension cannot connect to Restbase.") from server "https://wikimedia.org/api/rest_v1/":): {\displaystyle p \left(p , e^+ \nu \right) d }
Failed to parse (SVG (MathML can be enabled via browser plugin): Invalid response ("Math extension cannot connect to Restbase.") from server "https://wikimedia.org/api/rest_v1/":): {\displaystyle d \left(p, \gamma \right) ^3He }
Failed to parse (SVG (MathML can be enabled via browser plugin): Invalid response ("Math extension cannot connect to Restbase.") from server "https://wikimedia.org/api/rest_v1/":): {\displaystyle ^3He \left(^3He, 2p\right) ^4He }
The pp2 and pp3 chains are catalyst induced branches of helium-4 production. pp2 begins at the helium-3 reaction. It looks like:
Failed to parse (SVG (MathML can be enabled via browser plugin): Invalid response ("Math extension cannot connect to Restbase.") from server "https://wikimedia.org/api/rest_v1/":): {\displaystyle ^3He \left(^4He, \gamma \right) ^7Be }
Failed to parse (SVG (MathML can be enabled via browser plugin): Invalid response ("Math extension cannot connect to Restbase.") from server "https://wikimedia.org/api/rest_v1/":): {\displaystyle ^7Be \left(e^-, \nu \right) ^7Li }
Failed to parse (SVG (MathML can be enabled via browser plugin): Invalid response ("Math extension cannot connect to Restbase.") from server "https://wikimedia.org/api/rest_v1/":): {\displaystyle ^7Li \left(p, ^4He\right) ^4He }
pp3 chain begins after the helium-3 and helium-4 reaction of the pp2 chain.
Failed to parse (SVG (MathML can be enabled via browser plugin): Invalid response ("Math extension cannot connect to Restbase.") from server "https://wikimedia.org/api/rest_v1/":): {\displaystyle ^7Be \left(p, \gamma \right) ^8B }
Failed to parse (SVG (MathML can be enabled via browser plugin): Invalid response ("Math extension cannot connect to Restbase.") from server "https://wikimedia.org/api/rest_v1/":): {\displaystyle ^8B \left(\beta^+ \nu \right) ^8Be}
Failed to parse (SVG (MathML can be enabled via browser plugin): Invalid response ("Math extension cannot connect to Restbase.") from server "https://wikimedia.org/api/rest_v1/":): {\displaystyle ^8Be \left( ^4He\right) ^4He }
CNO cycle

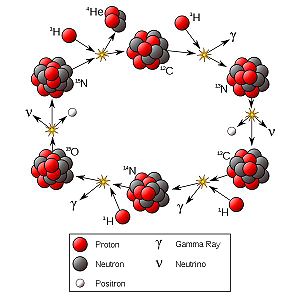
An important process that contributes to Hydrogen burning involving Carbon, Nitrogen and Oxygen is the CNO cycle. Four CNO cycles are known (for the complete list see Illiadis). Here we present the so-called CNO1 (see Table below and Figure 2).
| CNO1 |
| Failed to parse (SVG (MathML can be enabled via browser plugin): Invalid response ("Math extension cannot connect to Restbase.") from server "https://wikimedia.org/api/rest_v1/":): {\displaystyle ^{12}C(p,\gamma)^{13}N \ } |
| Failed to parse (SVG (MathML can be enabled via browser plugin): Invalid response ("Math extension cannot connect to Restbase.") from server "https://wikimedia.org/api/rest_v1/":): {\displaystyle ^{13}N(\beta^+\nu)^{13}C \ } |
| Failed to parse (SVG (MathML can be enabled via browser plugin): Invalid response ("Math extension cannot connect to Restbase.") from server "https://wikimedia.org/api/rest_v1/":): {\displaystyle ^{13}C(p,\gamma)^{14}N \ } |
| Failed to parse (SVG (MathML can be enabled via browser plugin): Invalid response ("Math extension cannot connect to Restbase.") from server "https://wikimedia.org/api/rest_v1/":): {\displaystyle ^{14}N(p,\gamma)^{15}O \ } |
| Failed to parse (SVG (MathML can be enabled via browser plugin): Invalid response ("Math extension cannot connect to Restbase.") from server "https://wikimedia.org/api/rest_v1/":): {\displaystyle ^{15}O(\beta^+\nu)^{15}N \ } |
| Failed to parse (SVG (MathML can be enabled via browser plugin): Invalid response ("Math extension cannot connect to Restbase.") from server "https://wikimedia.org/api/rest_v1/":): {\displaystyle ^{15}N(p,\alpha)^{12}C \ } |
Is interesting to note that in this cycle the abundances of C, N and O are not changed and these nuclei only serve as a catalyst to convert Hydrogen to Helium-4.
