User:DimitriosLazarou
Feynman diagrams
Complete calculations of Green's functions is a rather formidable task. Even the basic imaginary time evolution operator itself is an infinite series to all orders in the interaction Failed to parse (SVG (MathML can be enabled via browser plugin): Invalid response ("Math extension cannot connect to Restbase.") from server "https://wikimedia.org/api/rest_v1/":): {\displaystyle V(\vec{r}, \tau)} . One can simply get lost in the dozens of integrals; his physical intuition also doesn't get things any better. Feynman diagrams are both an exact mathematical representation of perturbation theory in infinite order and a powerful pictorial method showing in a unique way the physical content of a given expression.
The introduction of Feynman diagrams to Solid State Physics came naturally in order to give an alternate, and more easy to use, way to apply perturbative concepts beyond lowest orders. Given the so-called Feynman rules, a process can be illustrated in a much more transparent way. This alternate formulation is completely equivalent with the algebraic one. The correspondence with Quantum Field Theory, (QED, QCD and more) where the diagrams were first introduced, is more than obvious. Julian Schwinger once said rather bitterly that "Feynman brought quantum field theory to the masses". This will become apparent at the end.
Simple examples
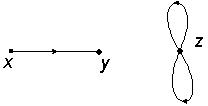
The quantity of interest is a Green's function. The language used more often in QFT is the propagator. More precisely we are interested in the n-th order corrections of it. Of course even from the 2nd order things become slightly complicated as we will see. Let's begin with no interaction at all, just the calculation of the probability of the propagation of a particle from position x to position y, or in a more accurate language the quantity Failed to parse (SVG (MathML can be enabled via browser plugin): Invalid response ("Math extension cannot connect to Restbase.") from server "https://wikimedia.org/api/rest_v1/":): {\displaystyle \left \langle \phi(x)\phi(y) \right \rangle } which as we know is represented by a Green's function, i.e. Failed to parse (SVG (MathML can be enabled via browser plugin): Invalid response ("Math extension cannot connect to Restbase.") from server "https://wikimedia.org/api/rest_v1/":): {\displaystyle G(x-y)} . In the language of Feynman diagrams it means that we draw an internal line at x and an external line at y.
The internal line is represented by a leg (line) having an arrow that moves to a vertex (a solid dot) ![]() and the external line by a leg moving from a vertex
and the external line by a leg moving from a vertex ![]() .
.
In order to construct the simplest diagram of all, we connect the two vertices in the only possible way, a line:
and by simplifying things we keep only the in between part
which is nothing else but Failed to parse (SVG (MathML can be enabled via browser plugin): Invalid response ("Math extension cannot connect to Restbase.") from server "https://wikimedia.org/api/rest_v1/":): {\displaystyle G(x-y) } .
1st order correction Let's try now a more complicated vertex, we will demonstrate the 1st order correction to Green's function. Let's suppose that we have 2 fields again Failed to parse (SVG (MathML can be enabled via browser plugin): Invalid response ("Math extension cannot connect to Restbase.") from server "https://wikimedia.org/api/rest_v1/":): {\displaystyle \phi(x),\phi(y)} , one in position x and another in y. . Hence we have 2 lines as before. But now the vertex we put in between (position z) is this one, we call it vertex Failed to parse (SVG (MathML can be enabled via browser plugin): Invalid response ("Math extension cannot connect to Restbase.") from server "https://wikimedia.org/api/rest_v1/":): {\displaystyle \phi^4(z)} :
Now we should connect the two lines, external and internal, with the above vertex in all possible ways. One way is just to connect x with y and ignore the vertex. Of course we take into account the vertex lines and we draw the appropriate (directional in this case) loops between them:
(If there are no arrows, our loops also have no arrows, we will show it next, in 2nd order correction).
Now the other possibility is to connect x with z and z with y. In our case it can be done in 2 ways as far as the internal line is concerned because there are 2 ingoing lines in the vertex, and in other 2 ways for the external lines, total of 4 ways. The lines from the vertex that remain unconnected, form a loop as before. Let's illustrate this, (having in mind that the topology of the following two diagrams is the same though and that in the future they will be represented as one diagram):
Therefore the three above diagrams represent the total average Failed to parse (SVG (MathML can be enabled via browser plugin): Invalid response ("Math extension cannot connect to Restbase.") from server "https://wikimedia.org/api/rest_v1/":): {\displaystyle \left \langle \phi(x)\phi^4(z)\phi(y) \right \rangle } which now can be analyzed in 2 terms that contain the Green's functions, first term for the first unconnected diagram and the 2nd term for the other two connected diagrams:
The simplification in terms of Feynman diagrams is obvious. This is the 1st order correction to the Green function.
2nd order correction
The 2nd order correction contains 2 vertices at z, z' positions, with no arrows now:
We want to compute Failed to parse (SVG (MathML can be enabled via browser plugin): Invalid response ("Math extension cannot connect to Restbase.") from server "https://wikimedia.org/api/rest_v1/":): {\displaystyle \left \langle \phi(x)\phi^4(z')\phi(y) \right \rangle }
. Let's just write the final result, no arrows this time to make it easier. The numbers in front of the diagrams are called combinatorial factors and they are obviously positive integers; they represent the total ways that this particular topology can be realized:
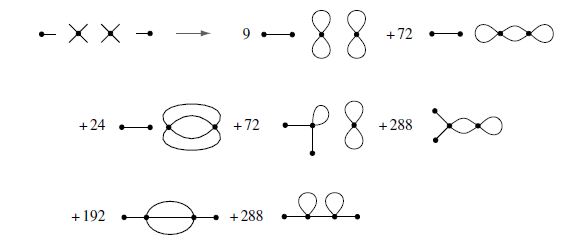
The problem of determining the combinatorics remains highly non-trivial. For example in the next correction, (3rd), the number of terms are (14-1)!!=135135. We will address it later. We will highlight some general remarks of Feynman diagrams and then we will attempt to calculate a more interesting case of interacting fermions.
General remarks
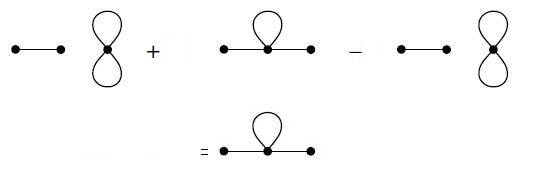
- Feynman diagrams represent the perturbative expansion. In order to be able to compute it we need the rules that relate the objects which consist the graph to analytical expressions. These are called Feynman rules, we will develop them later, for now we can just say that (i) we attach coordinates to all field lines and all of the vertices (ii) lines are the representation of Green's functions (propagators or correlation functions) (iii) multiply the graph by the factor Failed to parse (SVG (MathML can be enabled via browser plugin): Invalid response ("Math extension cannot connect to Restbase.") from server "https://wikimedia.org/api/rest_v1/":): {\displaystyle \frac{g^n}{n!}} (iv) integrate over all the internal coordinates, special care in loops (v) switching from coordinate space to momentum representation of the various quantities is possible and sometimes makes things easier. (vi) To obtain the Green's function we need to add the contributions emanating from the expansion of the denominator of the functional average. We will explicitly show it later. - The diagrams can be stretched, mirror inverted, twisting, rotating and otherwise deformed; only their topology matters. Also loops that are linked only to external or internal lines, can be removed in order to end up with a so-called "amputated" diagram. A loop linked only to an external / internal line represents a slight perturbation in our incoming particle beam, it's arbitrary. - We can attach a loop order to any diagram which is the number of inequivalent loops formed by segments of lines that correspond to Green functions. - When an interaction vertex does not connect to any of the external vertices, we call it vacuum graph. This graph does not correspond to the correction of Green's function in that order. Formally one can see that by expanding the denominator of the correspondent Green's function and by observing the exact cancellation of the vacuum graph's contribution (linked cluster theorem). For example in the 1st order perturbation theory, excluding the arrows for a second, we got these two different topologies:
But the first one is a vacuum graph. Therefore the graph that will eventually contribute to our calculation is only the second one. Pictorially:
Hence in the 2nd order of perturbation theory the diagrams that contribute are the following:
Fermions with pair interactions - The Feynman diagrams treatment
Let's illustrate how we can incorporate FD into a real-life example, system of fermions with pair interactions. The unperturbed Hamiltonian is
while the interaction term is written as
Obviously Failed to parse (SVG (MathML can be enabled via browser plugin): Invalid response ("Math extension cannot connect to Restbase.") from server "https://wikimedia.org/api/rest_v1/":): {\displaystyle H=H_{0}+V}
. will derive the Feynman rules for the diagrammatic expansion in orders of V of the following Green's function
For simplicity we will write
. The Failed to parse (SVG (MathML can be enabled via browser plugin): Invalid response ("Math extension cannot connect to Restbase.") from server "https://wikimedia.org/api/rest_v1/":): {\displaystyle \Psi}
fields are given in Heisenberg representation, we will convert them to Interaction representation. By subscript "0" we mean averages with respect to Failed to parse (SVG (MathML can be enabled via browser plugin): Invalid response ("Math extension cannot connect to Restbase.") from server "https://wikimedia.org/api/rest_v1/":): {\displaystyle e^-}
Failed to parse (SVG (MathML can be enabled via browser plugin): Invalid response ("Math extension cannot connect to Restbase.") from server "https://wikimedia.org/api/rest_v1/":): {\displaystyle ^\beta}
Failed to parse (SVG (MathML can be enabled via browser plugin): Invalid response ("Math extension cannot connect to Restbase.") from server "https://wikimedia.org/api/rest_v1/":): {\displaystyle ^H_{0}}
. We write for G:

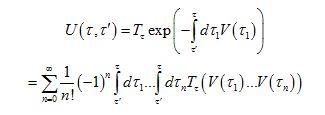
We will need the help of the following expansion, also known from QFT, it's the time-ordering operator expansion:
Now we insert this expansion into the G(b;a) relation above, adjusted to our needs. We get:
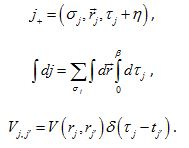
As always in these cases we are cautious about the ordering of creation and annihilation operators. The equation for V above forces us to keep creation operators to the left. This restriction can be realized formally in another more clear way. We add in infinitesimal time Failed to parse (SVG (MathML can be enabled via browser plugin): Invalid response ("Math extension cannot connect to Restbase.") from server "https://wikimedia.org/api/rest_v1/":): {\displaystyle \eta = 0^+} in the Failed to parse (SVG (MathML can be enabled via browser plugin): Invalid response ("Math extension cannot connect to Restbase.") from server "https://wikimedia.org/api/rest_v1/":): {\displaystyle \Psi ^+} fields to make sure that the time ordering is right, i.e. the time coordinate in Failed to parse (SVG (MathML can be enabled via browser plugin): Invalid response ("Math extension cannot connect to Restbase.") from server "https://wikimedia.org/api/rest_v1/":): {\displaystyle \Psi ^+} fields is always greater than the time coordinate in Failed to parse (SVG (MathML can be enabled via browser plugin): Invalid response ("Math extension cannot connect to Restbase.") from server "https://wikimedia.org/api/rest_v1/":): {\displaystyle \Psi} fields. of (b;a) we had before denoting all the indices, we switch to "j+" notation as:
Hence the tau-integrals of V in the above large expression can be written in the light of this new notation as
Armed with this machinery we can go back to the big expression for G(b;a) and rewrite it:
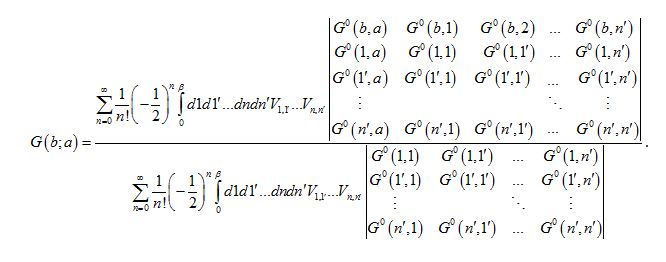
The averages are with respect to Failed to parse (SVG (MathML can be enabled via browser plugin): Invalid response ("Math extension cannot connect to Restbase.") from server "https://wikimedia.org/api/rest_v1/":): {\displaystyle H_{0}} only. Actually the average of the products of field operators in the numerator is the bare (2n+1)-particle Green's function Failed to parse (SVG (MathML can be enabled via browser plugin): Invalid response ("Math extension cannot connect to Restbase.") from server "https://wikimedia.org/api/rest_v1/":): {\displaystyle G_0^{2n+1}(b,1,1,...,n';a,1,1,...,n')} times a factor of Failed to parse (SVG (MathML can be enabled via browser plugin): Invalid response ("Math extension cannot connect to Restbase.") from server "https://wikimedia.org/api/rest_v1/":): {\displaystyle (-1)^{2n+1}=-1} . Denominator is Failed to parse (SVG (MathML can be enabled via browser plugin): Invalid response ("Math extension cannot connect to Restbase.") from server "https://wikimedia.org/api/rest_v1/":): {\displaystyle G_0^{2n}(1,1,...,n';1,1,...,n')} times Failed to parse (SVG (MathML can be enabled via browser plugin): Invalid response ("Math extension cannot connect to Restbase.") from server "https://wikimedia.org/api/rest_v1/":): {\displaystyle (-1)^{2n}=1} , hence the overall minus sign is taking care with another one. Using Wick's theorem for the above Green's functions we write G(b;a) in terms of the determinants containing the bare single particle Green's function Failed to parse (SVG (MathML can be enabled via browser plugin): Invalid response ("Math extension cannot connect to Restbase.") from server "https://wikimedia.org/api/rest_v1/":): {\displaystyle G^0(l,j)} . Let's do it:
Derivation of Feynman rules based on G(b;a):
We will derive the Feynman rules for the denominator and then for the numerator. We will see that a cancellation will take place exactly as before in the trivial examples. Here we will see it happening in detail.
(i) lines:
this is equal to the bare single particle Green's function Failed to parse (SVG (MathML can be enabled via browser plugin): Invalid response ("Math extension cannot connect to Restbase.") from server "https://wikimedia.org/api/rest_v1/":): {\displaystyle G^0(j_2,j_1)}
. As always in this case Failed to parse (SVG (MathML can be enabled via browser plugin): Invalid response ("Math extension cannot connect to Restbase.") from server "https://wikimedia.org/api/rest_v1/":): {\displaystyle \tau_1}
becomes Failed to parse (SVG (MathML can be enabled via browser plugin): Invalid response ("Math extension cannot connect to Restbase.") from server "https://wikimedia.org/api/rest_v1/":): {\displaystyle \tau_1+\eta}
(ii) interaction lines:
That's equal to the interaction term of the total Hamiltonian, i.e. Failed to parse (SVG (MathML can be enabled via browser plugin): Invalid response ("Math extension cannot connect to Restbase.") from server "https://wikimedia.org/api/rest_v1/":): {\displaystyle V_{jj'}}
.
(iii) vertices in point j. It's just a dot and it's equal to the sum over the internal variables,
(iv) Then, we draw (2n)! sets of n interaction lines, and
(v) for each of those sets we connect the 2n dots (vertices) with 2n fermion lines. Total number of ways this can be realized is (2n)!.
That would be all if there was no sign change. But there is and it's coming from the determinant's expansion. There will be lines that start from a point j, connecting to other vertices and then come back to j. Hence they form a loop. Loops are very important, especially in QFT, often we treat them in special ways. In our case now, a loop can start from a point and on its way can connect to others or not, but the final destination is always the initial point. Let's illustrate this for 1, 2 and 3 points respectively:
,
,
.
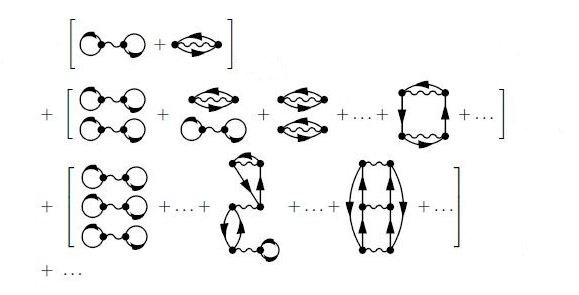
The overall sign will be Failed to parse (SVG (MathML can be enabled via browser plugin): Invalid response ("Math extension cannot connect to Restbase.") from server "https://wikimedia.org/api/rest_v1/":): {\displaystyle (-1)^F} where F is the number of the fermion loops. Then, all the other diagrams can be constructed by just pair wise interchange of the endpoints of the fermion lines, keeping everything else the same, the determinant sign changes accordingly. Therefore, (vi) We multiply by Failed to parse (SVG (MathML can be enabled via browser plugin): Invalid response ("Math extension cannot connect to Restbase.") from server "https://wikimedia.org/api/rest_v1/":): {\displaystyle \frac{1}{n!}{(\frac{-1}{2}}^n)(-1)^F} and we add the resulting (2n)! diagrams of order n. Hence for all n there are (2n)! terms of diagrams of order n. After all this the denominator's expansion as far as the Feynman diagrams are concerned, is the following:
plus 1 of course. The first line has 2 terms obviously, the second line contains 24 terms and the third line 720 terms.
For the numerator now, the difference is the additional terms of fermionic fields Ψ(b) and Ψ(a). The dimension of the n'th order determinant goes from 2n to 2n+1 obviously. The first 3 Feynman rules remain the same, the 4th and 5th change slightly:
(iv) We draw (2n+1)! sets of n interacting lines and 2 external vertices at points a, b.
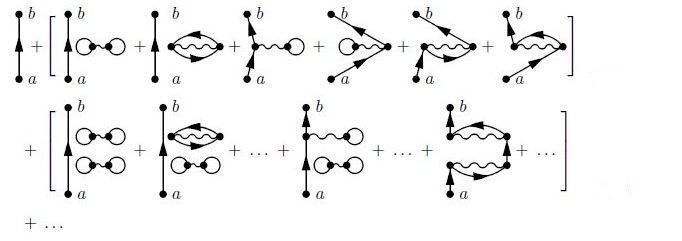
(v) For each set we connect the 2n+2 vertices with 2n+1 fermion lines, one leaving a, one entering b and one entering and leaving each internal vertex j. After all this the numerator's expansion becomes
where the first line contains 6 terms and the second line 120 terms.
A detailed analysis of the combinations and the factors in front of each diagram reveals that the denominator cancels exactly the disconnected diagrams of the numerator, leaving only the connected ones, exactly as before. Pictorially:
Hence we are in a position to give the final Feynman rules for this theory:
(i) lines: .
This is equal to the bare single particle Green's function Failed to parse (SVG (MathML can be enabled via browser plugin): Invalid response ("Math extension cannot connect to Restbase.") from server "https://wikimedia.org/api/rest_v1/":): {\displaystyle G^0(j_2,j_1)}
. As always in this case Failed to parse (SVG (MathML can be enabled via browser plugin): Invalid response ("Math extension cannot connect to Restbase.") from server "https://wikimedia.org/api/rest_v1/":): {\displaystyle \tau_1}
becomes Failed to parse (SVG (MathML can be enabled via browser plugin): Invalid response ("Math extension cannot connect to Restbase.") from server "https://wikimedia.org/api/rest_v1/":): {\displaystyle \tau_1+\eta}
.
(ii) interaction lines:
That's equal to the interaction term of the total Hamiltonian as before.
(iii) vertices in point j. It's just a dot and it's equal to the sum over the internal variables, as before.
(iv) At order n we draw all topologically different (and only the connected!) diagrams containing n interaction lines, 2 vertices a and b and 2n+1 fermion lines, one leaves a, one enters b and another one enters and leaves each internal vertex j.
(v) We multiply each diagram by Failed to parse (SVG (MathML can be enabled via browser plugin): Invalid response ("Math extension cannot connect to Restbase.") from server "https://wikimedia.org/api/rest_v1/":): {\displaystyle (-1)^F} where F is the number of fermion loops.
(vi) We sum over all the topologically different diagrams.

