Phy5645/Double pinhole experiment: Difference between revisions
No edit summary |
No edit summary |
||
| (2 intermediate revisions by the same user not shown) | |||
| Line 1: | Line 1: | ||
(a) As stated in the problem, we assume that the denominators are approximately the same between the two waves. This is justified because the corrections are only on the order of <math>d/L\!</math>, and we are interested in the case where <math>d<<L\!</math>. We require that the numerators have the same phase, namely <math>kr_{+}-kr_{-}=2\pi n\!</math>. We expand the LHS with respect to <math>d\!</math>, | (a) As stated in the problem, we assume that the denominators are approximately the same between the two waves. This is justified because the corrections are only on the order of <math>d/L\!</math>, and we are interested in the case where <math>d<<L\!</math>. We require that the numerators have the same phase, namely <math>kr_{+}-kr_{-}=2\pi n\!</math>. We expand the LHS with respect to <math>d\!</math>, | ||
| Line 20: | Line 16: | ||
(b) Let us work in units in which <math>k = 1</math>; that is, we measure all lengths in units of <math>1/k</math>. | (b) Let us work in units in which <math>k = 1</math>; that is, we measure all lengths in units of <math>1/k\!</math>. We then set <math>d = 20\!</math> and <math>L = 1000\!</math>. Here is the interference pattern. We first plot the pattern along the <math>y\!</math> axis <math>(x = 0):\!</math> | ||
| Line 26: | Line 22: | ||
(c) | (c) Using the same parameters as before, we now plot the pattern on the <math>xy\!</math> plane: | ||
[[Image:Double_pinhole_plot_2.JPG]] | [[Image:Double_pinhole_plot_2.JPG]] | ||
(d) | (d) We use the same parameters as in (b) and (c). First, we plot the pattern along the <math>y\!</math> axis <math>(x = 0):\!</math> | ||
[[Image:Double_pinhole_plot_3.JPG]] | [[Image:Double_pinhole_plot_3.JPG]] | ||
We now plot the pattern on the plane: | |||
[[Image:Double_pinhole_plot_4.JPG]] | [[Image:Double_pinhole_plot_4.JPG]] | ||
The main difference is the absence of the interference pattern. | The main difference is the absence of the interference pattern. | ||
Back to [[Stern-Gerlach Experiment]] | Back to [[Stern-Gerlach Experiment#Problem|Stern-Gerlach Experiment]] | ||
Latest revision as of 13:20, 18 January 2014
(a) As stated in the problem, we assume that the denominators are approximately the same between the two waves. This is justified because the corrections are only on the order of Failed to parse (SVG (MathML can be enabled via browser plugin): Invalid response ("Math extension cannot connect to Restbase.") from server "https://wikimedia.org/api/rest_v1/":): {\displaystyle d/L\!} , and we are interested in the case where Failed to parse (SVG (MathML can be enabled via browser plugin): Invalid response ("Math extension cannot connect to Restbase.") from server "https://wikimedia.org/api/rest_v1/":): {\displaystyle d<<L\!} . We require that the numerators have the same phase, namely Failed to parse (SVG (MathML can be enabled via browser plugin): Invalid response ("Math extension cannot connect to Restbase.") from server "https://wikimedia.org/api/rest_v1/":): {\displaystyle kr_{+}-kr_{-}=2\pi n\!} . We expand the LHS with respect to Failed to parse (SVG (MathML can be enabled via browser plugin): Invalid response ("Math extension cannot connect to Restbase.") from server "https://wikimedia.org/api/rest_v1/":): {\displaystyle d\!} ,
- Failed to parse (SVG (MathML can be enabled via browser plugin): Invalid response ("Math extension cannot connect to Restbase.") from server "https://wikimedia.org/api/rest_v1/":): {\displaystyle \begin{align} k(r_{+}-r_{-})&\approx k\left\{\left(\sqrt{L^{2}+x^{2}+y^{2}}+\frac{yd}{2\sqrt{L^{2}+x^{2}+y^{2}}}\right) \right. \\ &-\left.\left(\sqrt{L^{2}+x^{2}+y^{2}}-\frac{yd}{2\sqrt{L^{2}+x^{2}+y^{2}}}\right)\right\}\\ &=k\frac{dy}{\sqrt{L^{2}+x^{2}+y^{2}}} \end{align} }
Therefore,Failed to parse (SVG (MathML can be enabled via browser plugin): Invalid response ("Math extension cannot connect to Restbase.") from server "https://wikimedia.org/api/rest_v1/":): {\displaystyle k\frac{dy}{\sqrt{L^{2}+x^{2}+y^{2}}}=2\pi n\!}
and hence
- Failed to parse (SVG (MathML can be enabled via browser plugin): Invalid response ("Math extension cannot connect to Restbase.") from server "https://wikimedia.org/api/rest_v1/":): {\displaystyle \frac{y}{\sqrt{L^{2}+x^{2}+y^{2}}}=n\frac{\lambda}{d}\!}
(b) Let us work in units in which Failed to parse (SVG (MathML can be enabled via browser plugin): Invalid response ("Math extension cannot connect to Restbase.") from server "https://wikimedia.org/api/rest_v1/":): {\displaystyle k = 1}
; that is, we measure all lengths in units of Failed to parse (SVG (MathML can be enabled via browser plugin): Invalid response ("Math extension cannot connect to Restbase.") from server "https://wikimedia.org/api/rest_v1/":): {\displaystyle 1/k\!}
. We then set Failed to parse (SVG (MathML can be enabled via browser plugin): Invalid response ("Math extension cannot connect to Restbase.") from server "https://wikimedia.org/api/rest_v1/":): {\displaystyle d = 20\!}
and Failed to parse (SVG (MathML can be enabled via browser plugin): Invalid response ("Math extension cannot connect to Restbase.") from server "https://wikimedia.org/api/rest_v1/":): {\displaystyle L = 1000\!}
. Here is the interference pattern. We first plot the pattern along the Failed to parse (SVG (MathML can be enabled via browser plugin): Invalid response ("Math extension cannot connect to Restbase.") from server "https://wikimedia.org/api/rest_v1/":): {\displaystyle y\!}
axis Failed to parse (SVG (MathML can be enabled via browser plugin): Invalid response ("Math extension cannot connect to Restbase.") from server "https://wikimedia.org/api/rest_v1/":): {\displaystyle (x = 0):\!}
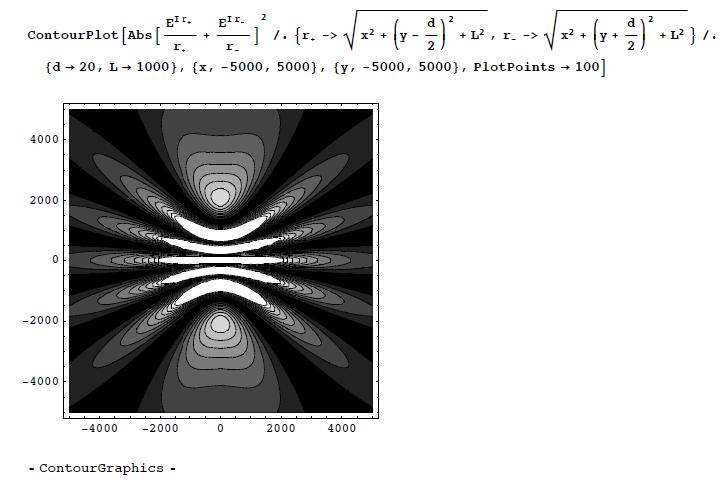
(c) Using the same parameters as before, we now plot the pattern on the Failed to parse (SVG (MathML can be enabled via browser plugin): Invalid response ("Math extension cannot connect to Restbase.") from server "https://wikimedia.org/api/rest_v1/":): {\displaystyle xy\!}
plane:
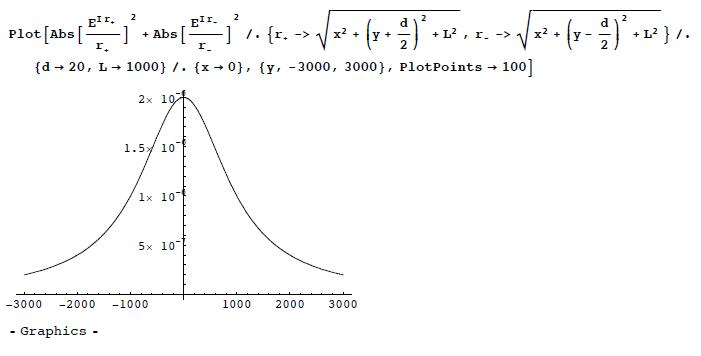
(d) We use the same parameters as in (b) and (c). First, we plot the pattern along the Failed to parse (SVG (MathML can be enabled via browser plugin): Invalid response ("Math extension cannot connect to Restbase.") from server "https://wikimedia.org/api/rest_v1/":): {\displaystyle y\!}
axis Failed to parse (SVG (MathML can be enabled via browser plugin): Invalid response ("Math extension cannot connect to Restbase.") from server "https://wikimedia.org/api/rest_v1/":): {\displaystyle (x = 0):\!}
We now plot the pattern on the plane:
The main difference is the absence of the interference pattern.
Back to Stern-Gerlach Experiment


