Stern-Gerlach Experiment
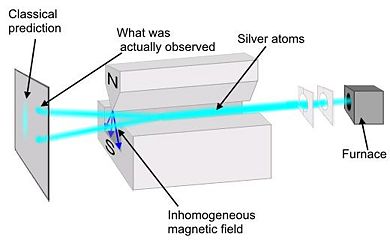
Preformed in 1922 by Walter Stern and Otto Gerlach, this experiment demonstrated that particles have intrinsic spin. A collimated monochromatic beam of silver atoms (Ag) is subjected to an inhomogeneous magnetic field. Silver was chosen because it has all of its shells full except for one additional electron in the shell. It is necessary to use a non-uniform magnetic field because, if the field was uniform, the trajectory of the silver atoms would be unaffected. In a non-uniform field the force on one end of the dipole is greater than the other.
Classical theory would predict that there would be a continuous line at the collector plate because the orientation of the spin would be completely random. However, at the collector there was only two spots. The atoms were deflected in the vertical direction by specific amount equal to , thus showing that spin is quantized. Because there were only two spots at the collector, we conclude that the electron is a spin ½ particle.
It is important to note here that this spin does not arise because the particle is spinning. If this were the case, then it would mean that parts of the spinning electron would be moving faster than the speed of light.
History
While our present understanding of the Stern-Gerlach experiment is that it demonstrates the fact that electrons have spin, one must keep in mind that the experiment was performed in 1922, three years before the concept of electronic spin was introduced and four years before modern quantum theory was introduced. As a matter of fact, the results of this experiment were originally taken as a confirmation of the old quantum theory of Bohr and Sommerfeld.
Sommerfeld, in the old quantum theory, had predicted the spatial quantization of trajectories and the directional quantization in a magnetic field . He knew that the magnetic moment , where the orbital gyromagnetic ratio Sommerfeld understood the principle of the experiment as soon as 1918. And he expected a lot from it because it would have been the first proof of quantization in a non-radiative process.
One could argue, however, that there should be three spots and not two. Imagine an electron in a circular uniform motion around a proton. The component of angular momentum is quantized to integer multiples of . In a magnetic field, the plane of the trajectory could have three directions corresponding, respectively, to an angular momentum parallel, antiparallel, or perpendicular to the field with or
This is not the case - as soon as 1918, Bohr proved that the trajectory for which was unstable. One must, therefore, only observe two spots, corresponding to . This is exactly what Stern and Gerlach observed.
Furthermore, by measuring , they found that, to a few percent, the magnetic moment of an atom was
as predicted by Bohr and Sommerfeld. Therefore, it was believed that the experiment had confirmed the old quantum theory. However, in our modern quantum theory, may be zero, which would appear to contradict the results of the Stern-Gerlach experiment. However, if one accounts for electronic spin, then one will correctly predict two spots.
Problem
(Double Pinhole Experiment)
Besides the Stern-Gerlach experiment, the double slit experiment also demonstrates the difference between quantum mechanics and classical mechanics. However, let us instead consider a double pinhole experiment rather than a double slit experiment because the former is mathematically simpler and still embodies the basic physics that we wish to demonstrate.
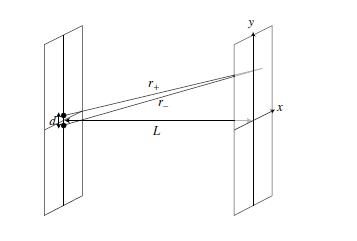
Suppose that a beam of electrons, traveling along the axis, hits a screen at with two pinholes at . For a point on a second screen at , the distance from each pinhole is given by A spherical wave is emitted from each pinhole; the waves from each add, and the wave function at a given point on the second screen is
where
(a) Considering just the exponential factors, show that constructive interference appears approximately at
where
(b) Make a plot of the intensity as a function of , by choosing Failed to parse (SVG (MathML can be enabled via browser plugin): Invalid response ("Math extension cannot connect to Restbase.") from server "https://wikimedia.org/api/rest_v1/":): {\displaystyle d =20,\!} and Failed to parse (SVG (MathML can be enabled via browser plugin): Invalid response ("Math extension cannot connect to Restbase.") from server "https://wikimedia.org/api/rest_v1/":): {\displaystyle L=1000.\!} The intensity Failed to parse (SVG (MathML can be enabled via browser plugin): Invalid response ("Math extension cannot connect to Restbase.") from server "https://wikimedia.org/api/rest_v1/":): {\displaystyle \left |\psi(0,y)\right |^{2}} is interpreted as the probability distribution for the electron to be detected on the screen, after repeating the same experiment many many times.
(c) Make a contour plot of the intensity Failed to parse (SVG (MathML can be enabled via browser plugin): Invalid response ("Math extension cannot connect to Restbase.") from server "https://wikimedia.org/api/rest_v1/":): {\displaystyle \left |\psi(x,y)\right |^{2}} as a function of Failed to parse (SVG (MathML can be enabled via browser plugin): Invalid response ("Math extension cannot connect to Restbase.") from server "https://wikimedia.org/api/rest_v1/":): {\displaystyle x\!} and Failed to parse (SVG (MathML can be enabled via browser plugin): Invalid response ("Math extension cannot connect to Restbase.") from server "https://wikimedia.org/api/rest_v1/":): {\displaystyle y\!} , for the same parameters.
(d) If you place a counter at both pinholes to see if the electron has passed one of them, all of a sudden the wave function "collapses". If the electron is observed to pass through the pinhole at Failed to parse (SVG (MathML can be enabled via browser plugin): Invalid response ("Math extension cannot connect to Restbase.") from server "https://wikimedia.org/api/rest_v1/":): {\displaystyle y=+d/2\!} , the wave function becomes
- Failed to parse (SVG (MathML can be enabled via browser plugin): Invalid response ("Math extension cannot connect to Restbase.") from server "https://wikimedia.org/api/rest_v1/":): {\displaystyle \psi_{+}(x,y)=\frac{e^{ikr_{+}}}{r_{+}}.}
If it is observed to pass through that at Failed to parse (SVG (MathML can be enabled via browser plugin): Invalid response ("Math extension cannot connect to Restbase.") from server "https://wikimedia.org/api/rest_v1/":): {\displaystyle y=-d/2\!} , the wave function becomes
- Failed to parse (SVG (MathML can be enabled via browser plugin): Invalid response ("Math extension cannot connect to Restbase.") from server "https://wikimedia.org/api/rest_v1/":): {\displaystyle \psi_{-}(x,y)=\frac{e^{ikr_{-}}}{r_{-}}.}
After repeating this experiment many times with 50:50 probability for each the pinholes, the probability on the screen will be given by
- Failed to parse (SVG (MathML can be enabled via browser plugin): Invalid response ("Math extension cannot connect to Restbase.") from server "https://wikimedia.org/api/rest_v1/":): {\displaystyle \left |\psi_{+}(x,y)\right |^{2}+\left |\psi_{-}(x,y)\right |^{2}\!}
instead. Plot this function on the Failed to parse (SVG (MathML can be enabled via browser plugin): Invalid response ("Math extension cannot connect to Restbase.") from server "https://wikimedia.org/api/rest_v1/":): {\displaystyle y} -axis, and also show the contour plot, to compare its pattern to the case when you do not place a counter. What is the difference from the case without the counter?
External Links
Simulation of the Stern-Gerlach Experiment
Another simulation of the Stern-Gerlach Experiment


