Self-organized criticality and earthquakes
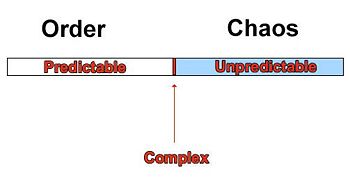
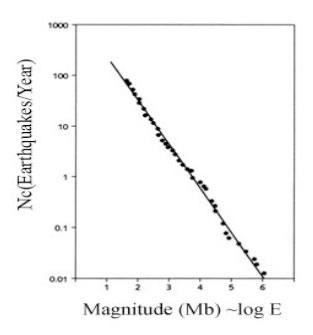
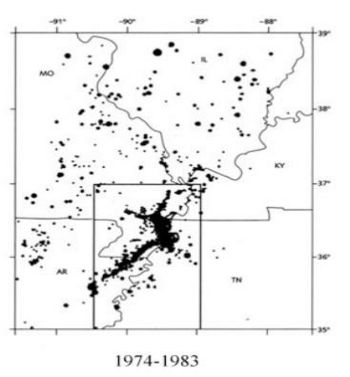
In 1987 the team of Bak, Tang, and Weisenfeld presented a paper on "Self-organized Criticality" which hoped to provide a very simplified model to explain the complexity that is found in nature. Prior to this, many models describing complex systems had been developed however there was no general theory of complexity built on a strong mathematical foundation. The theory with which the team attempted in their paper explains the "self-organized critical state" (SOC) by comparing it to that of a steep sand pile which emits avalanches of all sizes as more sand is added to the system. This state is characterized by the fact that the system has self-organized itself to a point where it is on the border between predictability and unpredictability to the so called "edge of chaos." For the specific case of earthquakes, it can be postulated that the crust of the earth is a highly self-organized system which features earthquakes that are unpredictably strong, where the intensity and frequency of the quakes follow a power law distribution. Power law distributions are a key aspect of SOC.
Some of the criticisms of the theory include that it does not mathematically show why the critical systems follow a power law distribution and it also does not explain why the systems self organize.
The Sandpile Paradigm
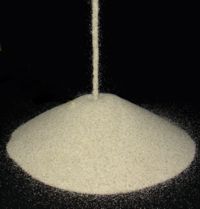
Consider a pile of sand of any size. As sand is added to the pile(at any position not just limited to the center) the size and slope of the pile will become larger and larger. Soon it will reach a slope where the addition of more sand will trigger avalanches that will increase in size as the slope of the pile also increases in size. Eventually this slope will reach a particular size where it will no longer increase due to the fact the amount of sand added will balance out with the amount of sand leaving the pile. This is known as the critical stationary state of the sandpile. At this point the individual dynamics of each grain of sand is not as important as a new emergent dynamic of the sandpile has become global. Any perturbation made to the system may cause avalanches that are either large or small perhaps causing the physical appearance of the sandpile to change but this system dynamic will remain complex. The same perturbation that might cause a small avalanche could also cause a large avalanche.
The Sandpile Model
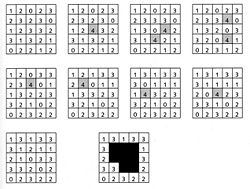
The best way to understand this is to consider a very simple model which can be easily recreated and simulated using a computer. Imagine a sandpile with equal sized sand granules that have no imperfections (to simplify the interaction between each sand granule and the ones next to it. As Bak puts it this is "theoretical physicist's sand". Sand is then randomly added to a site in the growing pile and thus increasing its height. When a particular site becomes too high it will distribute the sand at that site to the 4 adjacent sites around it. So if the highest a particular site can reach is 4 units of sand then those 4 units will be taken away from that site and 1 will be given to each of the 4 adjacent sites.
To better understand what is occurring refer to the very useful applet that was created by Maslov.
One of the significant features of the model is that it does not matter what the initial state of the sandpile is in when the experiment begins or where the sand happens to be randomly added to. If all that is known about the beginning state of the pile is that each site has less than 3 units of sand (the maximum before an 'avalanche' occurs) then we know that there are no immediate unstable sites. No avalanches will take place until a site reaches 4 units of sand in which case it will topple to the adjacent sites. If that causes one of the adjacent sites to have more than 3 units of sand then that site will also topple and so on until the avalanche resolves itself and all of the sites are back down to 3 or less units of sand. With units of sand continuing to be added to the system after the avalanches, eventually the system will reach the stationary state that was mentioned before. Figure 3 on the left also shows the result of the domino effect that takes place when an avalanche begins.
After using the sand pile applet and noticing the designs that occur in the final states of the sand pile we notice that the avalanches have caused a fractal structure to form into the sand pile a lot like Norway's coast.
The 'edge of chaos' and power law distributions
Power law distribution in the sand pile model
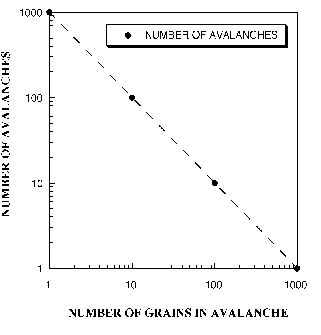
Avalanches in the sand pile model follow the very simple power law: Graphing the logs of the intensity of the avalanches which occur in the sand pile model in relation to the logarithm of their frequencies one obtains a power law distribution which looks like the following:
Measurement of the power law exponent for the avalanches in the sandpile model comes out to be approximately 1.1. This corresponds to an exponent that fits with one of the more elegant properties of the SOC model which states that exponents such as t in the power law formula have values between 1 and 3/2 and that these values are universal.
At the boundary
Systems that are complex like those found in nature are systems that have self-organized regardless of the state in which they began organizing. These systems tune themselves to a critical point where power law behavior is seen. A relevant comparison to a topic in our class is looking at the critical point in the phase transition diagram located at the top of the transition line between liquid and gas. At this critical point a continuous phase transition can be made from a gas state to a liquid state. The behavior of the gas state is the part where self-organization is taking place and the behavior is predictable. As it approaches the critical point it has reached its complex state and now it makes a transition into a super critical fluid. There is a power law distribution in the size and frequency of gas bubbles which are coexisting with the liquid in this state.
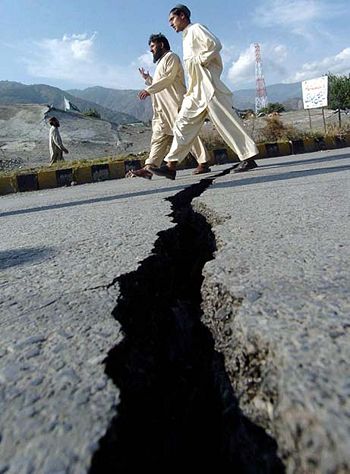
The crust of the Earth is in a self-organized critical state
The Gutenberg-Richter Law
Sources
Self-Organized Criticality: Emergent Complex Behavior in Physical and Biological Systems. Cambridge Lecture Notes in Physics Part 10.
How Nature Works: The Science of Self-Organized Criticality. Per Bak.
Modeling Extinction. M.E.J. Newman, R.G. Palmer. Santa Fe Institute Studies in the Sciences of Complexity.
Introduction to Self-Organized Criticality & Earthquakes by Nathan Winslow. http://www.econ.iastate.edu/classes/econ308/tesfatsion/SandpileCA.Winslow97.htm
